Interactive Dashboards
Stop spending hours manually building financial dashboards. Upload your data and get an interactive, board-ready dashboard in under 60 seconds: no charting, no formatting.
Financial Overview
Apr 2026Revenue
$2.4M
+12%
Gross Profit
$840K
+8%
Cash
$1.2M
−3%
Monthly Revenue
63+
dashboard templates
< 60s
to generate
What you get
Everything built in, nothing left to figure out
How it works
From messy data to confident decisions
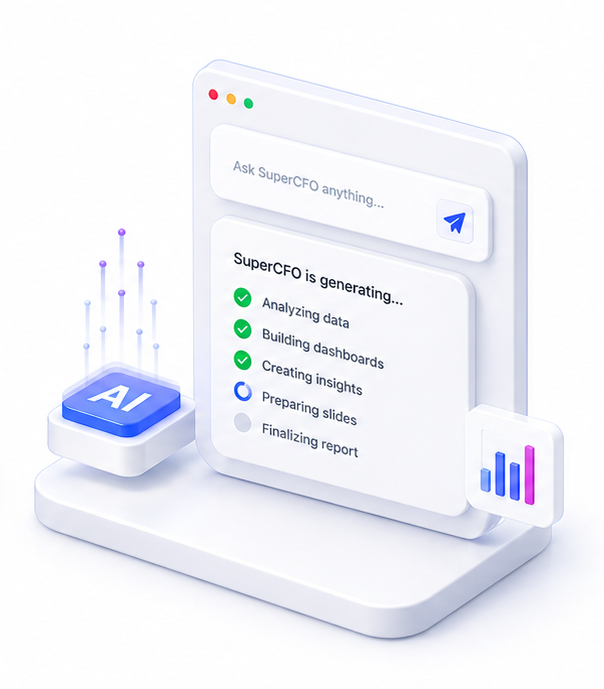
No prompting expertise required. Connect your data, select a ready-made tool, and get a complete financial output in under 60 seconds.
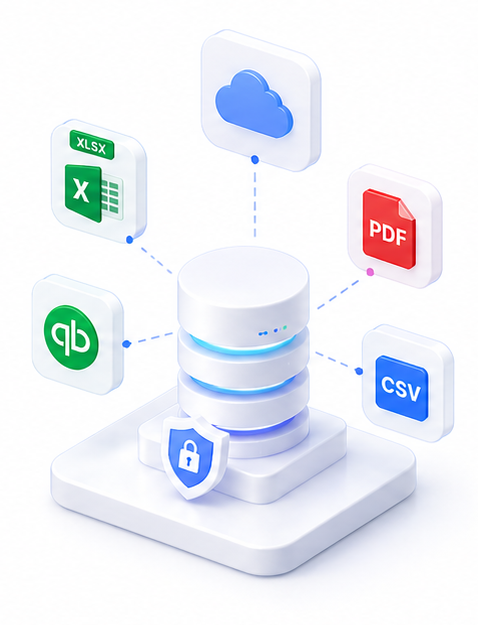
Upload your financial data
Upload an Excel, CSV, PDF, or image file containing your financial data. SuperCFO reads and extracts the relevant figures automatically.
Run via
Select a dashboard category
Choose from 63+ templates: or let SuperCFO suggest the best fit. Categories include P&L, Cash Flow, Business Health, Sales, SWOT, and more.
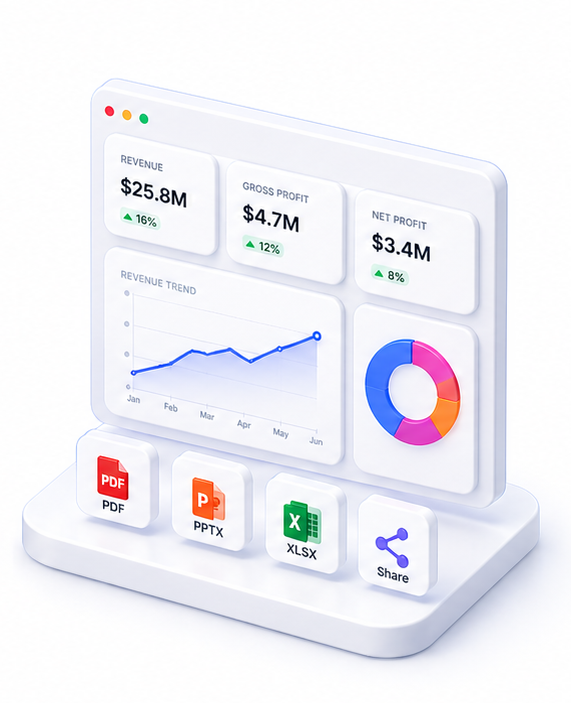
Review and share your dashboard
Your interactive dashboard is ready in seconds. Amend via chat, download as PDF, or share via link with stakeholders.
Live preview
Financial Overview
Apr 2026Revenue
$2.4M
+12%
Gross Profit
$840K
+8%
Cash
$1.2M
−3%
Monthly Revenue
63+
dashboard templates
< 60s
to generate
About Interactive Dashboards
SuperCFO transforms raw financial data into fully interactive HTML dashboards in under 60 seconds, using 63+ pre-built templates spanning Financial Overview, Cash Flow, Profitability, Sales Performance, Credit Analysis, SWOT, and more.
Upload your Excel, CSV, PDF, or image files. SuperCFO reads and understands the data, selects the most appropriate template, and generates a complete dashboard: with Chart.js visualisations, KPI cards, variance tables, and sidebar navigation: ready to share or download as PDF.
No coding required. No manual chart building. You review the output and request amendments via chat if needed. Every generated dashboard is saved to your history and shareable via link.
FAQ

One platform. Every finance use case.
Automate. Analyze. Act. All in one intelligent platform.